Computer Science
Projects
The Capstone Experience provides the educational capstone for all students majoring in computer science at Michigan State University. Teams of students build software projects for corporate clients. For information on becoming a project sponsor, see Project Sponsorship or contact Dr. Wayne Dyksen. The following are the project sponsors and projects for the fall of 2012.
![]()
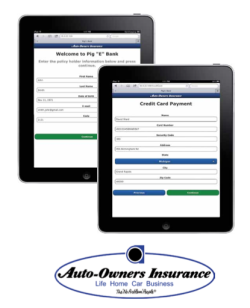
Auto-Owners Insurance: Pig “E” Bank
 Auto-Owners Insurance is a Fortune 500 company that offers many types of insurance including life annuity accounts, which are investment structures designed to provide payments at specified intervals.
Pig “E” Bank is a web application that provides a convenient and easy-to-use way for users to make electronic deposits into annuity accounts. The users may be the annuity account holder or even a family member or friend making a deposit as a gift.
Electronic deposits are made with a simple three- step process. If the deposit is a gift, a user can send an additional small gift like a teddy bear or a note to the annuity account holder. Payment options include credit cards or electronic fund transfers.
Pig “E” Bank works with mobile web browsers. With such accessibility, making deposits into annuity accounts has never been easier or more convenient.
Our system also includes an administrator web site, which is used to track and possibly resolve payments. Payment records can be searched by date and by the account holder’s name.
Our Pig “E” Bank web interface is written in HTML and JavaScript. The backend is written in C# using ASP. NET.

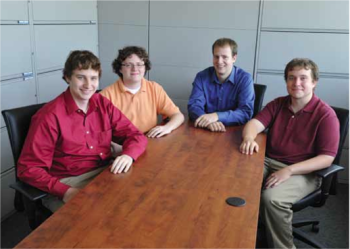
Team Members (L to R): David Ward, Benjamin Szymczak, Nathan Siro
![]()
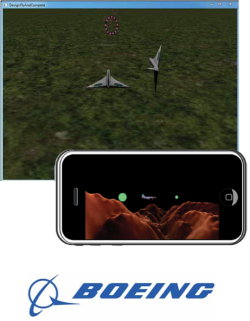
The Boeing Company: Design, Fly and Compete Sim Suite V2.0
 Boeing is the world’s leading aerospace company and the largest manufacturer of commercial jetliners and military aircraft combined.
Research and development of new products represent significant investments for Boeing. In addition, training users on existing products represent significant investments for Boeing customers. To minimize time and maximize efficiency, Boeing utilizes complex modeling and simulation software systems.
Design, Fly and Compete Sim Suite V2.0 is a flight simulator that features six degrees of freedom with realistic physics of flight. Players can choose from four different planes to navigate through nine different obstacle courses. A new feature of V2.0 is a multiplayer mode where players can interact with each other via an internet connection.
In addition to a standalone Microsoft Windows desktop version, our flight simulator also includes a web version, which runs in both Chrome and Safari for use on Desktops, iPhones, and iPads. Our web version is designed with extensions to provide an immersive feature-filled user experience.
The Microsoft Windows desktop application utilizes the Qt framework and OpenSceneGraph for the application and DIS and HLA for networking. The browser version uses HTML5, JavaScript and WebGL for the application and Socket.IO for communication.
Team Members (L to R): Dan Sosnowski, Kevin Liening, Max Ellison, Jake Newsted
![]()
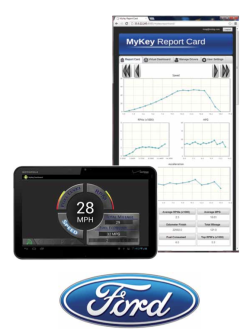
Ford Motor Company: MyKey Report Card
 Founded in 1903, the Ford Motor Company is a Fortune 500 company that develops and produces some of the most innovative cars and trucks in the world.
One such innovation is the Ford MyKey system, which allows owners to program a key that sets safety restrictions for each driver. For example, owners can limit the top speed of a car or the maximum volume of the radio.
As an addition to the Ford MyKey system, our MyKey Report Card provides owners with a report card of the driving habits of each of a car’s drivers by collecting data from the vehicle using an Android phone or tablet.
Users view the report cards using the MyKey Report Card web site. Users can customize the data displayed on their report cards and specify additional methods of report card delivery. Users can set emergency notification options that send text messages or e-mail if a vehicle exceeds a specified threshold.
The MyKey Dashboard, an Android application that supplies driver data from the vehicle, displays real-time data in a virtual instrument panel while sending driving data to a centralized database.
The MyKey Report Card website is written in HTML5 and Java EE 6. The driving data is stored using SQL Server 2008. The Android application uses the Android SDK and OpenXC vehicle interface, which enables an Android device to receive data from a vehicle.
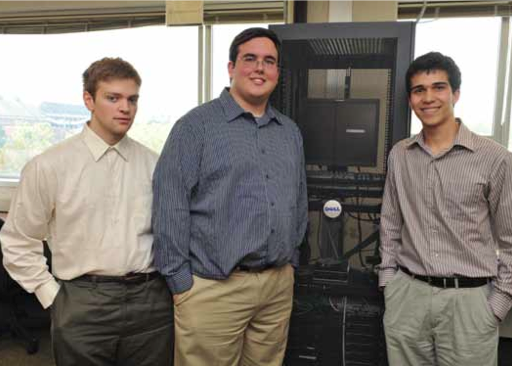
Team Members (L to R): Kevin Klemmer, Andrew Crouch, Brandon D’Orazio, Alex Conklin
![]()
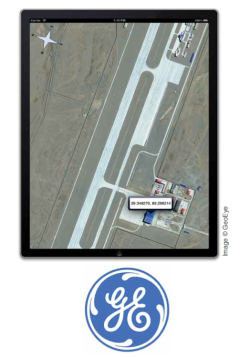
GE Aviation: Mobile Avionics Satellite Imagery
By using state-of-the-art digital technology, GE Aviation is meeting the needs of the world’s evolving airspace. Their products offer the flexibility and enhanced performance that are essential in safety-critical aircraft operations.
The Federal Aviation Administration (FAA) has approved the use of iPads by pilots, which allows state-of-the- art mobile technologies to provide innovative replacements for outdated technologies along with a host of new ones.
When pilots must fly to remote areas or unfamiliar airports, ultra-high-resolution satellite images can provide valuable visual insights about the airport and the area surrounding their destination.
Our Mobile Avionics Satellite Imagery iPad app provides a convenient way of displaying and manipulating GE Aviation’s ultra-high-resolution satellite images. The app incorporates the use of familiar touch screen gestures as well as the ability to display the latitude and longitude of any point in the image as shown in the example to the right.
The iPad app provides pilots with information in a way that is more convenient and lightweight than the equivalent paper maps while taking advantage of the image quality that an Apple iPad has to offer.
Our Mobile Avionics Satellite Imagery iPad app is written in Objective-C. The images are preprocessed by an application written in C++ and follow the GeoTIFF image specification.

Team Members (L to R): Andy Matteson, Zack Pepin, Mateus Braga
![]()
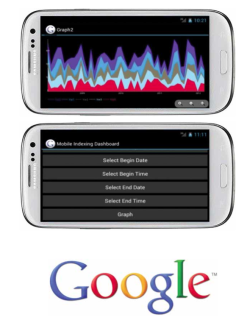
Google: Indexing System Mobile Dashboard
 Google’s mission is to organize the world’s information and make it universally accessible and useful. This is made possible through various support tools including Google’s indexing system dashboard.
The dashboard monitors and displays information about various Google systems to ensure continuous smooth operation. Google uses an online dashboard system that requires the indexing network engineers to carry a laptop computer at all times in order to access the dashboard.
Our Indexing System Mobile Dashboard provides the capability of monitoring Google’s indexing systems from an Android mobile device, thus freeing their engineers from needing to carry a laptop computer.
After launching the Mobile Dashboard, a menu is displayed from which a user can choose which indexing system performance graphs they would like to view. Users can also choose which time periods of data they would like to see.
Users can pan and zoom on graphs to monitor various indexing system variables. Users can highlight any specific variable, which makes it stand out in the time series graph.
The Indexing System Mobile Dashboard serializes data using Google Protocol Buffers for transfer between the phone and server. The server and Android are programmed in the Java programming language.

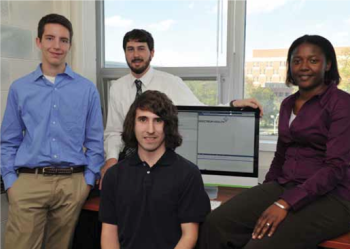
Team Members (L to R): Mike Platt, Jason Harris, Anthony Talerico, Karthik Balasubramanian
![]()
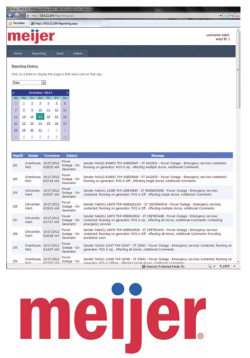
Meijer: IT ePager System
 Meijer is a family owned chain of supercenters committed to providing quality food and products to its customers with over 190 stores throughout the Midwest, including Michigan.
In order to provide the best service possible for their customers, Meijer must keep each of these stores up and running 24 hours a day. To do so, system emergencies must be handled efficiently and effectively.
Our IT ePager System is designed to notify the appropriate Meijer associates quickly in the event of a system emergency. Associates at Meijer can quickly contact each other in case of power outages, pricing calculations, recalls or other important tasks that require immediate attention. Messages can be sent to multiple employees and even to entire departments.
Users of the IT ePager System can send messages to mobile phones, email or pagers. An individual user can specify the mode of communication with which they want to be paged.
The IT ePager System features a message template creation option, which enables administrative users to create and save a message template for future use. Users of the system load these pre-defined templates and need only fill in a few key variable fields before sending a message.
Our IT ePager System is web-based, written in C# and ASP.NET. Microsoft SQL Server 2008 is used for the database backend.
Team Members (L to R): Mike Sanburn, David Oeffner, Mark Schwerzler, Nick Ovenhouse
![]()
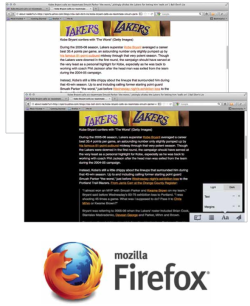
Mozilla Corporation: Reader Mode for Desktop Firefox
 Mozilla Firefox is a free, open source web browser that brings a multitude of new and innovative functionalities to both its mobile and desktop clients.
Over the years, websites have become more cluttered with ads and other miscellaneous content that distracts the user from the main content of interest. Some browsers have implemented a reader mode, which loads a new view of a page, with all extraneous content removed. Most of these are plugins that must be downloaded and installed separately from the browser.
Produced with guidance from Mozilla Developers, our Reader Mode for Desktop Firefox provides a built-in reader mode for the desktop version of Firefox.
Reader mode can be enabled for a site by clicking the easy to find button in the address bar. When Reader mode is activated, the current page is replaced with a de-cluttered version of itself. A preferences menu allows the user to change the font, font color, font size and various other attributes of the page.
The Reader Mode button is written in XUL. The Reader Mode functionality is implemented with JavaScript and the Readability.com algorithm. The Reader mode page and general styling are done with CSS and HTML.

Team Members (L to R): Michael Anderson, Matthew Vorce, Chelsea Carr, Kevin Woodward
![]()
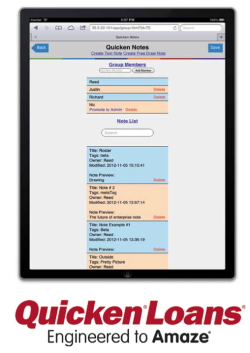
Quicken Loans: Secure Note Taking and Collaboration Tools
 Quicken Loans is a financial institution headquartered in Detroit, Michigan. Founded in 1985, Quicken Loans specializes in mortgage lending and financing.
Quicken Loans currently uses third party collaboration tools to store notes on the Internet so they can be easily accessible to other team members. Storing these notes on servers outside of Quicken Loans creates a potential security issue since the notes can contain sensitive customer information.
Designed in collaboration with our clients from Quicken
Loans, our Secure Note Taking and Collaboration Tools provide a single unified location that stores all of the notes on Quicken Loans’ internal computer servers.
After logging in, users can create rich text notes or freehand drawing notes. Users can save attachments to their notes and upload photos to free draw notes and draw on them. Users can do text-based searches for notes.
Quicken Loans teams can collaborate by organizing and sharing groups of notes, which are accessible only to other members of the team.
Our Secure Note Taking and Collaboration Tools run in any modern desktop web browser. It is also compatible with iPhones, iPads and Android mobile devices.
Our system is written in HTML5 and JavaScript with CSS3 styling. The underlying database is Microsoft SQL Server and the backend API is written in PHP.
Team Members (L to R): Richard Hofmeister, Justin Mrkva, Nicholas Speeter, Reed Fielstra
![]()
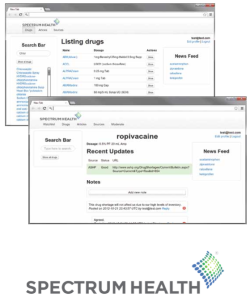
Spectrum Health Systems: Medication Shortages Dashboard
 Spectrum Health is a health care organization operating in Western Michigan, with its headquarters located in Grand Rapids. The non-profit organization aims to improve the health of the communities in which they operate.
To work effectively, Spectrum Health pharmacists need to be able to visualize and analyze medication shortages in order to make educated decisions on how to manage them. Our Medication Shortages Dashboard enables pharmacists to manage and deal with medication shortages easily and effectively.
The Medication Shortages Dashboard provides pharmacists with an at-a-glance overview of current national drug shortages. The pharmacists can rate the impact of each shortage on their hospital, and collaborate with other pharmacists in order to determine the best course of action.
Each pharmacist can create and maintain a watchlist of drugs, allowing the pharmacist to be quickly notified about status changes on those drugs.
Information about medication shortages is pulled in real time from the Food and Drug Administration (FDA) and the American Society of Hospital Pharmacists (ASHP). The data is molded into a format that is easy to process, and is displayed to the user in a clean, color-coded interface.
The dashboard is built using Ruby on Rails, HTML/CSS, and JavaScript.
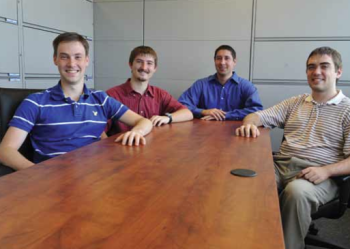
Team Members (L to R): Grayson Wright, Eric Dostle, Aaron Cosentino, Ramata Koumare
![]()
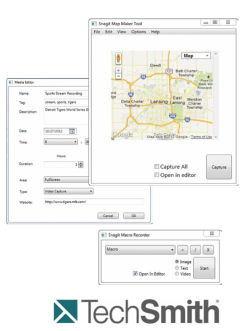
TechSmith: Snagit Power Tools
 TechSmith is a software development company based in Okemos, Michigan that focuses primarily on the creation of screencasting tools that allow users to capture or record their computer screen. Their products, such as Camtasia, Snagit, and Jing, are used all over the world by large corporations, small businesses, educators and individuals.
Snagit, TechSmith’s most popular and best-selling product, is an application that allows users to quickly and conveniently capture their computer screen and annotate the results in a variety of ways.
Our Snagit Power Tools are a suite of four applications that extend Snagit’s functionality, allowing users to do potentially tedious and time-consuming tasks with relative ease.
The Screen Recording DVR Tool schedules Snagit captures for a future time and date. The Macro Recorder Tool records macros ending in a Snagit capture.
The Social Media Stream Tool displays images from a user’s Facebook account that can be edited with SnagIt. The Map Maker Tool captures Google maps, which can then be edited with Snagit.
Our Snagit Power Tools are written in C#, use WPF for the interfaces and use the Snagit COM SDK to communicate with Snagit.
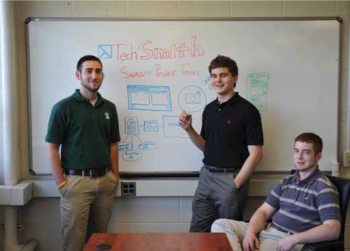
Team Members (L to R): Benjamin Blaut, David Markachev, Kyle Gosen
![]()
Urban Science: Mobile Geography Management
 Urban Science delivers maximum results in the automotive industry for OEMs (original equipment manufacturers) worldwide through optimization software and scientific analysis. Their products and services enable clients to evaluate and manage their dealer networks more effectively and more efficiently.
One very important aspect of dealer network management is that of geography management, which allows OEMs to view and modify geographic territories defined by census data.
Our Mobile Geography Management application extends this concept to mobile devices, specifically the iPad, featuring touch gestures for an optimized and well-formatted display. Since dealer networks and therefore geography assignments change constantly, we provide several visual cues allowing for straightforward interactions and analysis of data.
After launching the application, the user can zoom and view geographic territories and automotive dealerships within the United States in one continuous motion. The user can select and edit any geographic territory with the touch of a finger.
Our application provides a mobile solution for managing geographic territories and assists in achieving maximal results for OEM dealer network evaluation and management.
The Mobile Geography Management application is written using JavaScript, HTML5, and PHP. Geographic data is stored using an SQL Server 2008 database.

Team Members (L to R): Forrest Young, Dominykas Siaudvytis, Brandon Kienle, Jake Wesorick
![]()
Whirlpool Corporation: Connected Appliances Analytics Dashboard
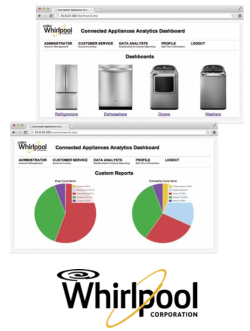 Whirlpool Corporation, headquartered in Benton Harbor, Michigan, is a global leader in appliance manufacturing across all major categories.
As a constant innovator in the field, Whirlpool is now offering “Connected Appliances” that give greater control to customers and greater insight into how Whirlpool products are used.
Connected Appliances provide a large amount of information to Whirlpool. Our Connected Appliances Analytics Dashboard acquires this data, presenting it in a user-friendly format.
Whirlpool customer service representatives can use this system to aid a customer in identifying their online account ID by using minimal information to search customer records. Representatives can view the current state of a customer’s appliances and assist in their use or recommend future products.
To guide future strategy in research, development, and marketing, the Connected Appliances Analytics Dashboard provides an overview for broad categories of appliances, such as dishwashers or refrigerators. In addition to these dashboards, Whirlpool users can create custom queries of the data to gain understanding into very specific customer usage and needs.
Our Connected Appliances Analytics Dashboard uses a variety of technologies, including Java, MySQL, PHP, CSS, jQuery, and JavaScript.
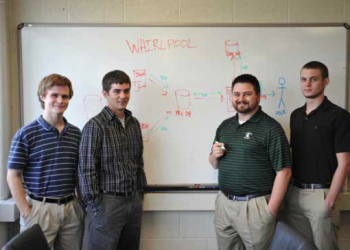
Team Members (L to R): Zachary Taylor, Joseph Tuohey, James Solce, Derrick Neier